Newsletter – June 2025

The Share Market
The global equity markets in June 2025 have demonstrated remarkable resilience in the face of complex macroeconomic headwinds, with both the Australian and American indices posting solid gains despite persistent inflationary concerns and geopolitical tensions. The month has been characterised by a shift in investor sentiment from cautious optimism to more confident risk-taking, as markets have successfully navigated policy uncertainties and benefited from improved economic data releases.
ASX 200 Performance
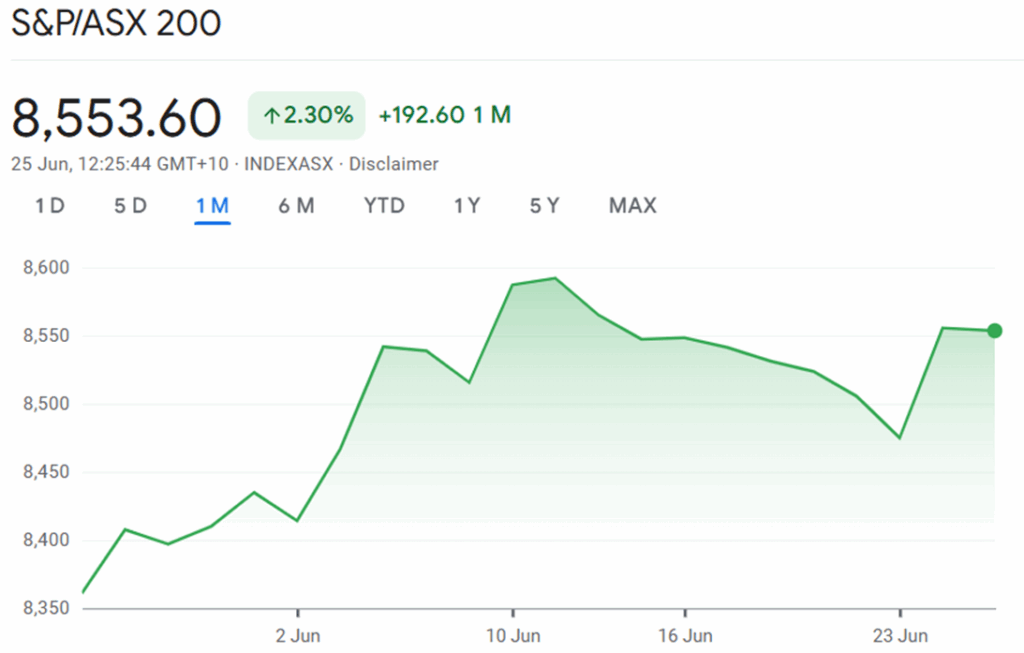
The S&P/ASX 200 has demonstrated remarkable resilience throughout June 2025, with the index showing significant upward momentum despite global uncertainties. Based on the attached chart data, the ASX 200 began June at approximately 8,350 points and has climbed steadily to reach 8,553.60 points by 25 June, representing a gain of approximately 2.30% for the month.
Source: Google Finance
Early June Consolidation Phase
The first week of June saw the ASX 200 trading in a relatively narrow range between 8,350 and 8,430 points. This consolidation period reflected market uncertainty as investors awaited clarity on several key factors, including inflation data and geopolitical developments in the Middle East. The materials sector, which represents a significant portion of the ASX 200, experienced some weakness during this period, declining 1.33% as commodity prices faced pressure.
Mid-Month Breakthrough and Acceleration
A notable inflection point occurred around 10 June, when the index broke through the 8,540 resistance level and began a sustained rally5. This breakthrough coincided with improved market sentiment following the release of Australian inflation data, which showed the monthly Consumer Price Index indicator rising 2.4% in the 12 months to May 2025, down from 2.8% in April. This represented the lowest annual trimmed mean inflation reading in recent months, providing hope for potential Reserve Bank of Australia policy adjustments.
The rally gained momentum as the index pushed towards 8,590 points by mid-June, supported by strong performance across multiple sectors. Industrials led the gains with seven stocks hitting 52-week highs, while materials contributed six new highs during this period. The telecommunications and energy sectors also showed strength, with three companies each reaching yearly peaks.
Late June Volatility and Recovery
The final week of June brought increased volatility, with the index experiencing a temporary pullback to around 8,470 points on 23 June. This decline of 0.43% reflected profit-taking activities and concerns about escalating Middle East tensions. However, the market demonstrated its underlying strength by quickly recovering, with a particularly strong session on 24 June that saw the index surge 0.95% to 8,555.5 points.
The recovery was driven by news of a potential ceasefire between Iran and Israel, which eased geopolitical tensions and reduced demand for safe-haven assets. Materials and financials led the gains, adding more than 1.8% each, whilst the energy sector faced headwinds, declining 3.89% as oil prices slumped on reduced supply concerns.
Sector Performance Dynamics
The ASX 200's June performance has been characterised by divergent sector performance. The banking sector has been a standout performer, with Commonwealth Bank reaching new record highs and trading at $188.60 per share, giving it a market capitalisation of $315 billion. The major banks have benefited from expectations of sustained higher interest rates and strong credit quality.
Conversely, the energy sector has faced challenges, particularly in the latter part of June. Beach Energy and Woodside Energy have struggled as oil prices declined, with WTI crude falling 5.2% to US$64.97 per barrel and Brent crude dropping 5.2% to US$67.77 per barrel following the Iran-Israel ceasefire news.
S&P 500 Performance
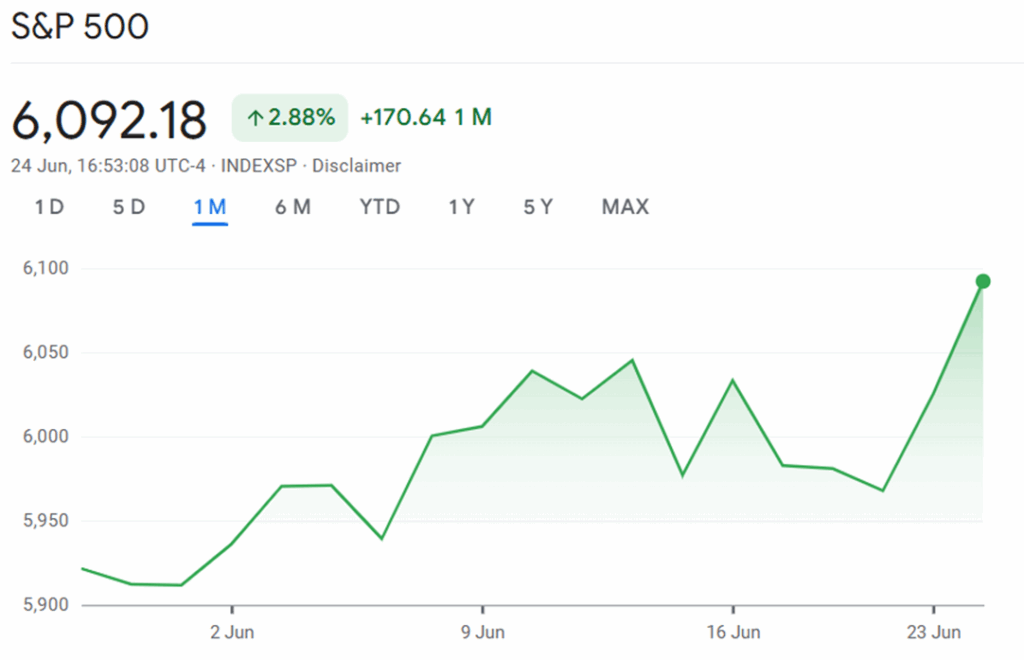
The S&P 500 has shown impressive resilience and growth throughout June 2025, climbing from approximately 5,920 points at the beginning of the month to 6,092.18 points by 24 June, representing a gain of approximately 2.88%. This performance builds on a strong year-to-date return and reflects the market's ability to look beyond near-term uncertainties towards longer-term growth prospects.
Source: Google Finance
Federal Reserve Policy Influence
The S&P 500's June performance has been significantly influenced by Federal Reserve policy signals and economic data releases. Fed Chair Jerome Powell's testimony to Congress emphasised the central bank's commitment to maintaining current interest rates until there is greater clarity on inflation trends and the economic impact of tariffs. The Fed has maintained the federal funds rate at 4.25%-4.50% for the fourth consecutive meeting, providing stability for equity markets.
Powell's cautious approach has been driven by expectations that inflation will rise substantially throughout 2025, with core PCE inflation forecasted to reach 3.1% in 2025 before moderating to 2.4% in 202614. This measured stance has provided support for equity valuations, as investors appreciate the Fed's data-dependent approach rather than aggressive policy shifts.
Market Structure and Trading Patterns
The S&P 500's June performance has been characterised by steady accumulation phases punctuated by periods of accelerated gains. The index demonstrated strong technical behaviour, with successful tests of support levels around 5,920 points early in the month, followed by a sustained advance through multiple resistance levels.
Notable trading sessions included strong gains on 5 June, when the index advanced 1.03% to close at 6,000.36, marking a psychological milestone. The momentum continued with further advances throughout the month, culminating in a robust 1.1% gain on 24 June as investors responded positively to reduced geopolitical tensions.
Earnings and Corporate Performance
The S&P 500's advance has been supported by expectations of improving corporate earnings following the second-quarter reporting period. BMO Capital Markets' chief investment strategist Brian Belski has revised his year-end target upward to 6,700, representing approximately a 10% increase from current levels. This optimistic outlook reflects expectations that markets are transitioning from a "scare me" to a "show me" phase, with performance broadening across sectors.
At least eight Wall Street firms have raised their S&P 500 targets after initially lowering them during April's tariff-related market decline. This reversal in analyst sentiment demonstrates growing confidence in the market's ability to navigate policy uncertainties and maintain its upward trajectory.
Behavioural Finance in Current Market Conditions
The strong performance of both the ASX 200 and S&P 500 during June 2025 provides valuable insights into behavioural finance theory in practice. The market movements observed demonstrate several key principles, including loss aversion during the early consolidation phase and herding behaviour once clear trends emerged around mid-June. The initial cautious sentiment reflected investors' tendency to feel the pain of potential losses more acutely than equivalent gains, explaining why markets often underreact to positive news initially before momentum builds.
The breakthrough rallies that characterised both indices highlight how cognitive biases influence market dynamics. Overconfidence bias has become particularly relevant as markets have rallied, with analysts revising price targets higher and investors potentially underestimating risks whilst overestimating their ability to time movements. Anchoring bias is evident in the revision of S&P 500 analyst targets, where professionals anchor to recent performance when making forward-looking assessments.
Understanding these behavioural patterns offers practical benefits for investors. Research shows that incorporating behavioural insights into investment processes can improve returns by 3-6% annually by reducing the "behaviour gap" that occurs when investors deviate from their strategy. In the current environment of elevated valuations and strong momentum, recognising tendencies toward overconfidence and overreaction becomes particularly important for risk management and maintaining disciplined investment approaches.
Conclusion
June 2025 has delivered strong returns for both the ASX 200 and S&P 500, with gains of 2.30% and 2.88% respectively, demonstrating market resilience amid inflation concerns, geopolitical tensions, and policy uncertainties. The performance patterns highlight the importance of understanding both fundamental market drivers and the psychological factors that influence investor behaviour, particularly during periods of sustained momentum and elevated valuations. As both markets continue to navigate evolving conditions, the lessons from June's performance provide valuable insights for positioning portfolios to benefit from ongoing trends whilst remaining prepared for potential shifts in sentiment and market dynamics.
The Residential Property Market
Data recently released from Cotality's (previously called CoreLogic) Home Value Index (HVI) reveals a nuanced picture of the Australian residential property market as of May 2025. The national housing market continued its upward trajectory, albeit at a slower pace, with a 0.5% rise in dwelling values for the month and a 3.3% increase over the past year. This update draws on Cotality’s comprehensive analytics and insights from other reliable sources to provide a detailed look at the latest trends, city-by-city performance, and what’s driving the market.
National Overview: Steady Growth Amidst Changing Conditions
The Australian housing market has demonstrated resilience in 2025, with national dwelling values rising by 0.5% in May, marking the fourth consecutive month of growth after a brief dip earlier in the year. Over the first five months of 2025, the national index climbed 1.7%, reflecting a moderate but consistent recovery. The annual growth rate of 3.3% is the lowest since August 2023, indicating a clear easing from the stronger gains seen in previous years.
Cotality estimates the total value of residential real estate reached $11.4 trillion by the end of May, underscoring the sector’s significance in the broader economy. The rolling quarterly trend for national dwelling values was 1.3%, matching the previous quarter and highlighting a period of stability after volatility in late 2024 and early 2025.
Capital City Performance: Divergence Narrows
One of the most notable trends in May 2025 is the convergence in growth rates across Australia’s capital cities. The difference between the highest and lowest annual growth rates among capitals has narrowed to just 9.8 percentage points — the smallest gap since March 2021. This suggests that, for now, capital city housing markets are moving more in step than they have in years.
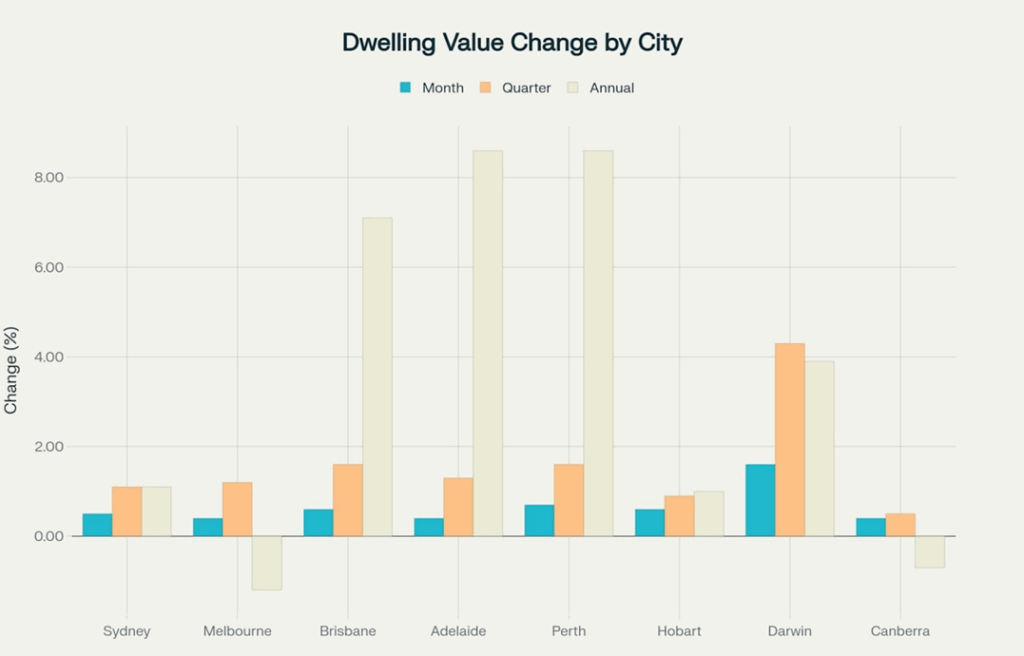
Darwin stood out among the capitals as the strongest performer in monthly growth, with dwelling values rising 1.6% over May and posting a solid 3.9% annual gain. The city’s median value reached $525,770, which remains notably lower than most other capitals, highlighting its relative affordability. This robust growth underscores Darwin’s appeal to investors and homebuyers looking for opportunities outside the more expensive southern markets.
Sydney’s market recorded a 0.5% monthly increase and a 1.1% annual rise in dwelling values, with a median value of $1,203,395. While this growth is modest compared to previous peaks, it marks a turnaround from the declines seen in early 2023. The city’s total return for the year stands at 4.1%, reflecting both capital gains and rental yields.
Melbourne’s housing values edged up by 0.4% in May, but the city remains in negative territory annually, with a -1.2% change over the past year. The median value is $791,303. Despite this, the rate of annual decline has eased significantly from -7.8% in January 2023, and values have been rising steadily since February 2025.
Brisbane continues to be one of the standout performers, with a 0.6% monthly increase and a robust 7.1% annual gain. The city’s median dwelling value is $917,992, and the total return for the year is 10.9%. This sustained growth is driven by strong demand and relative affordability compared to Sydney and Melbourne.
Adelaide and Perth posted the strongest annual gains among the capitals, each with an 8.6% increase over the past year. Monthly growth was 0.4% for Adelaide and 0.7% for Perth. Median values are $829,695 and $813,810, respectively. These markets have benefited from ongoing population growth and limited housing supply.
Hobart’s property market saw a 0.6% monthly rise and a 1.0% annual gain, with a median value of $673,858, reflecting steady but modest growth.
Canberra’s market was more subdued, with a 0.4% monthly rise but a -0.7% annual change and a median value of $855,663, indicating ongoing adjustment.
Regional Markets: Outpacing the Capitals
Regional Australia continued to outperform the combined capitals, with a 0.4% monthly rise and a 5.3% annual increase in dwelling values. The median value for regional dwellings is $678,818. Regional Western Australia and South Australia led the pace of annual gains, with increases of 12.5% and 12.4%, respectively.
This trend is largely attributed to affordability pressures in the capitals, pushing buyers towards outer suburbs and regional centres where homes are more accessible. According to Cotality’s research director Tim Lawless, “The median income no longer buys the median home…” driving a structural shift in buyer behaviour and supporting growth in fringe and regional markets.
Market Drivers: Interest Rates, Affordability, and Supply
The continued momentum in housing values is being fuelled by recent and anticipated interest rate cuts. The Reserve Bank of Australia’s rate reduction in May provided a boost to buyer confidence, with the capital city auction clearance rate rising to 65.1% — the highest since July 2024. Expectations of further cuts are likely to support housing values in June and beyond.
Affordability remains a central issue. With the median home now requiring more than half of a household’s gross income (assuming a 20% deposit), buyers are increasingly looking to more affordable locations. This has implications for infrastructure, transport, and planning, as demand shifts to the urban fringe and regional areas.
On the supply side, the flow of newly advertised properties rebounded in May, with 35,069 listings nationally over the four weeks to 1 June. However, properties are taking longer to sell, with the national median time on market rising to 34 days, up from 30 days in April. Vendor discounting rates have also tightened slightly, indicating sellers are having to adjust expectations to meet market conditions.
Rental Market: Growth Moderates
Rental growth continued to moderate in May, with national dwelling rents up 0.4% for the month. The annual change in rental values has slowed to 3.8%, the lowest in four years, reflecting a gradual return to more typical pre-pandemic conditions. Gross rental yields remain attractive in some markets, particularly Darwin and regional areas, supporting investor interest.
Outlook: What’s Next for the Australian Property Market?
Looking ahead, the outlook for the Australian residential property market is shaped by a mix of positive and negative factors. On the positive side, lower interest rates, government policy support, and persistent undersupply are expected to underpin demand. However, affordability constraints, longer selling times, and a gradual increase in supply may temper price growth in the coming months.
Cotality’s data suggests that while the pace of gains has slowed, the market remains on a stable footing. The convergence in growth rates across cities points to a more synchronised market, reducing the risk of sharp divergences seen in previous cycles. For buyers and sellers, understanding these dynamics will be key to navigating the evolving landscape.
Key Takeaways
- National dwelling values rose 0.5% in May 2025, with annual growth slowing to 3.3% — the lowest since August 2023.
- Brisbane, Adelaide, and Perth continue to lead capital city growth, while Sydney and Melbourne remain more subdued.
- Regional markets are outpacing capitals, driven by affordability pressures and a shift in buyer preferences.
- Interest rate cuts and expectations of further reductions are supporting market confidence and activity.
- Rental growth has moderated, and properties are taking longer to sell, reflecting more balanced market conditions.
As we move into the second half of 2025, the property market appears set for a period of moderate, broad-based growth, with affordability and interest rates remaining the key factors.
Inflation and Interest Rates
Inflation in Australia stayed steady at 2.4% for the year to March 2025, the lowest since early 2021. This is just above the market’s expectations but still within the Reserve Bank’s comfort zone. The RBA cut the cash rate in May to 3.85%, its first reduction since early 2023. This move was a response to easing price pressures and signs of slower growth at home and abroad.
With no major new inflation data since May, the focus is on how global events and local economic conditions might shape the Reserve Bank’s next moves on interest rates.
US Tariffs
Earlier in the year, the US announced new tariffs on a wide range of goods from several countries, including Australia. These tariffs caused concern about global trade and economic growth. The US has since paused most of these tariffs for negotiations, but as of late June, little progress has been made. The Reserve Bank has said that higher US tariffs could slow the global economy and might lower prices for some traded goods, but the exact impact on Australia is still unclear. The RBA is watching the situation closely and is ready to adjust its policy if needed.
Oil Prices and the Middle East
Oil prices have been up and down recently, mainly because of tensions between Israel and Iran. When tensions spiked, oil prices rose, which could have pushed up petrol and transport costs in Australia. However, a recent ceasefire has calmed markets and oil prices have eased. If conflict flares up again, oil prices could rise, potentially pushing up inflation and making the RBA’s job harder.
Predictions from Analysts and the Big Banks
Analysts and the big banks have adjusted their forecasts to reflect these global risks.
- KPMG: Following the Reserve Bank of Australia's (RBA) decision to cut the cash rate to 3.85% in May, KPMG's baseline forecast was for one more 25-basis-point cut in 2025, bringing the rate to 3.60% by year's end. However, KPMG also issued a separate, conditional forecast based on a potential escalation in the Middle East conflict and a resulting oil price shock. In that specific scenario, they projected the RBA would cut more aggressively, bringing the cash rate down to 3.1% by the end of the year to support the economy.
- The Big Banks: while NAB has consistently forecast a rate cut for the RBA's July meeting, the other major banks (ANZ, Commonwealth Bank, and Westpac) have their official forecasts pointing to August as the starting point for further cuts. However, this official caution is at odds with the wider market. As of late June, the ASX RBA Rate Tracker implies an 89% probability of a cut in July, indicating that investors and financial markets are almost certain the RBA will act sooner than most major banks predict.
If the RBA does deliver three more cuts, homeowners could see their monthly repayments fall by around $265 on a typical $600,000 mortgage with 25 years left. The Reserve Bank’s next move will depend on how the economy holds up and what happens overseas. Most analysts expect further rate cuts this year, but the exact timing and number will depend on the latest data and global events. For now, the focus is on supporting growth while keeping inflation in check.
